Data center power monitoring: 60 PDUs, live PUE & automated colo billing.
A comprehensive Ignition platform that monitors 60 Power Distribution Units in real time, gives operators live Power Usage Effectiveness (PUE), and automates multi-tier billing for 10 colocation customers — all from one “single pane of glass.”
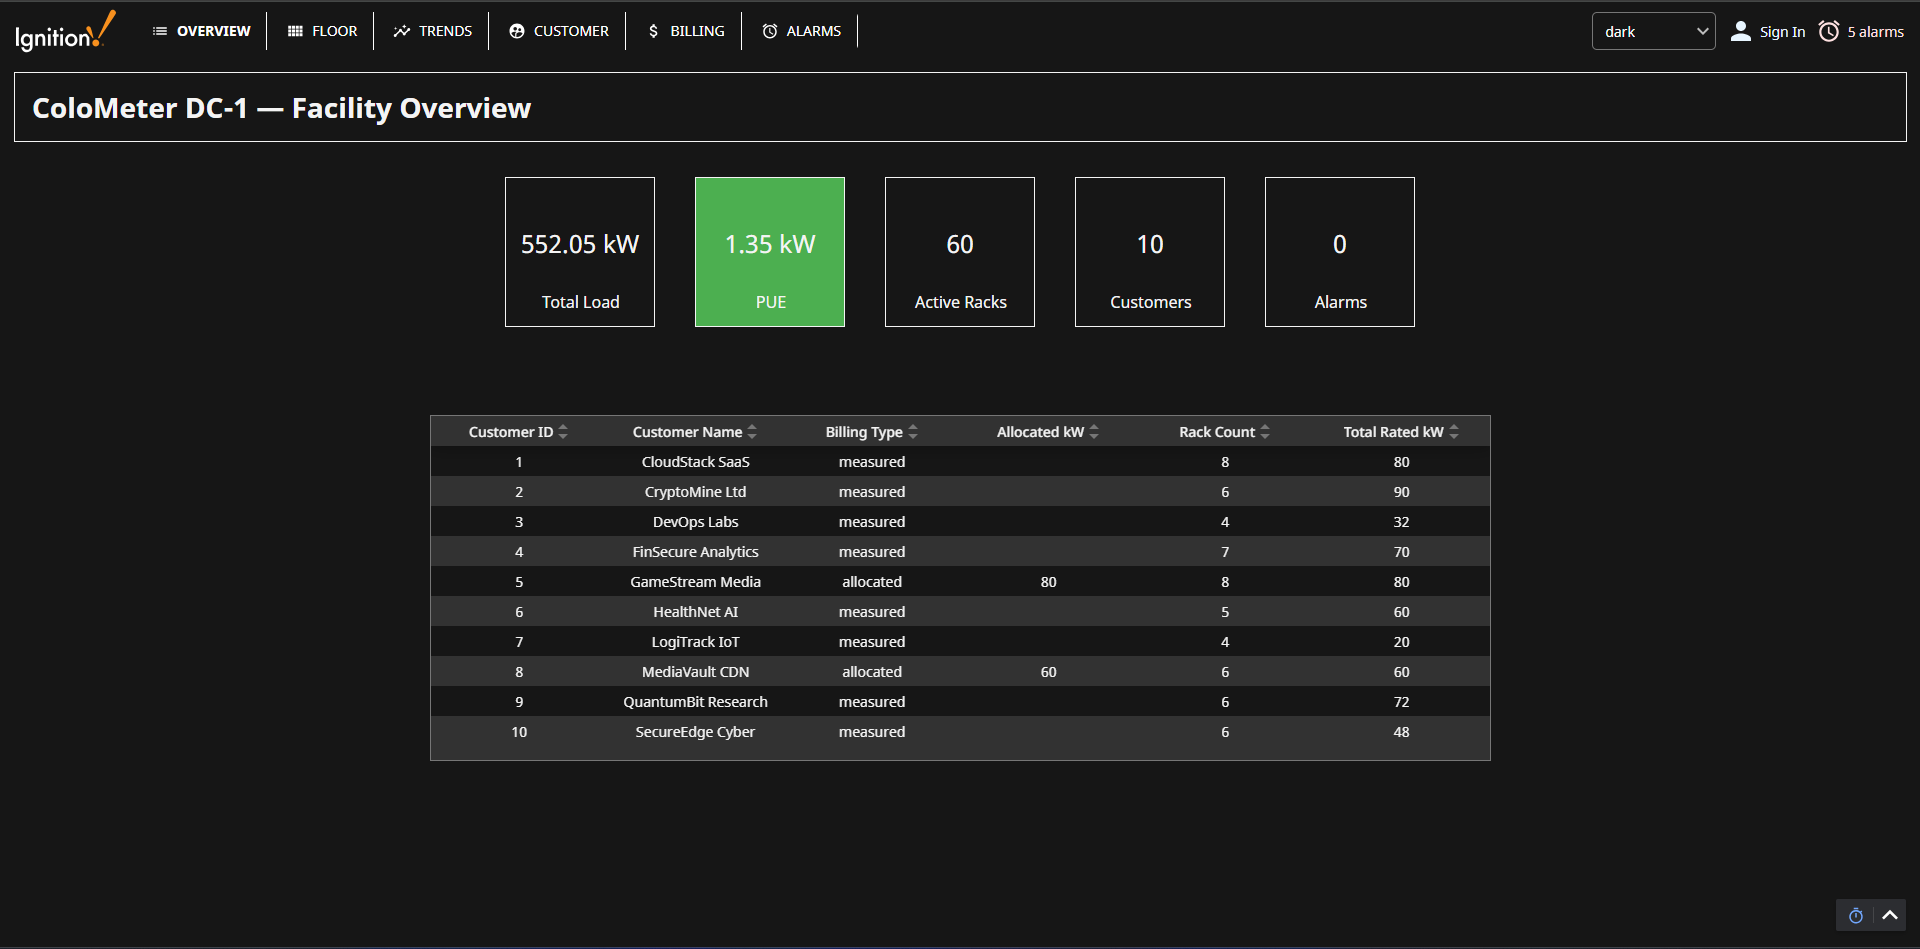
The facility overview: total load, live PUE, active racks and per-customer allocation at a glance
Purpose
This project is a comprehensive Ignition-based industrial platform designed to monitor 60 Power Distribution Units (PDUs) in real time — providing data center operators with critical efficiency metrics (PUE) and automated, multi-tier billing for colocation customers.
The Problem
Data center management is a constant balancing act between keeping equipment healthy and recovering the cost of power accurately. Monitoring 60 PDUs across multiple racks previously meant manual data logging or fragmented tools, which delayed insight into Power Usage Effectiveness (PUE).
Billing customers on varying structures — flat rates versus peak-demand rates — was labor-intensive, error-prone, and opaque to the end customer. The facility needed one system that could do both: monitor consumption and turn it into accurate, transparent invoices.
The core challenges
High-volume real-time processing — 60 units streaming voltage, current, power factor and energy, aggregated without latency
A dynamic billing engine that toggles between peak and normal rate structures against historical energy data
Sophisticated SQL database integration for that historical logging
A clean, scannable UI that stays readable while showing all 60 units at once
● THE SOLUTION
One "single pane of glass" for the whole facility.
Built on Ignition and structured around four pillars — health monitoring, live PUE, customer dashboards and automated billing.
Real-time floor plan & health
A color-coded floor plan shows at a glance which units run efficiently (green) and which exceed 90% capacity (red). Any unit opens to trend charts and live electrical metrics.
Dynamic PUE calculation
IT load is aggregated across all 60 racks to calculate PUE in real time. Held in the 1.1–1.4 target band, it drives smarter cooling and power distribution.
Advanced customer dashboards
Each of the 10 customers has a dedicated profile. The system filters the 60 PDUs to show only theirs — live power stats and estimated costs, in their own portal.
Automated billing & reporting
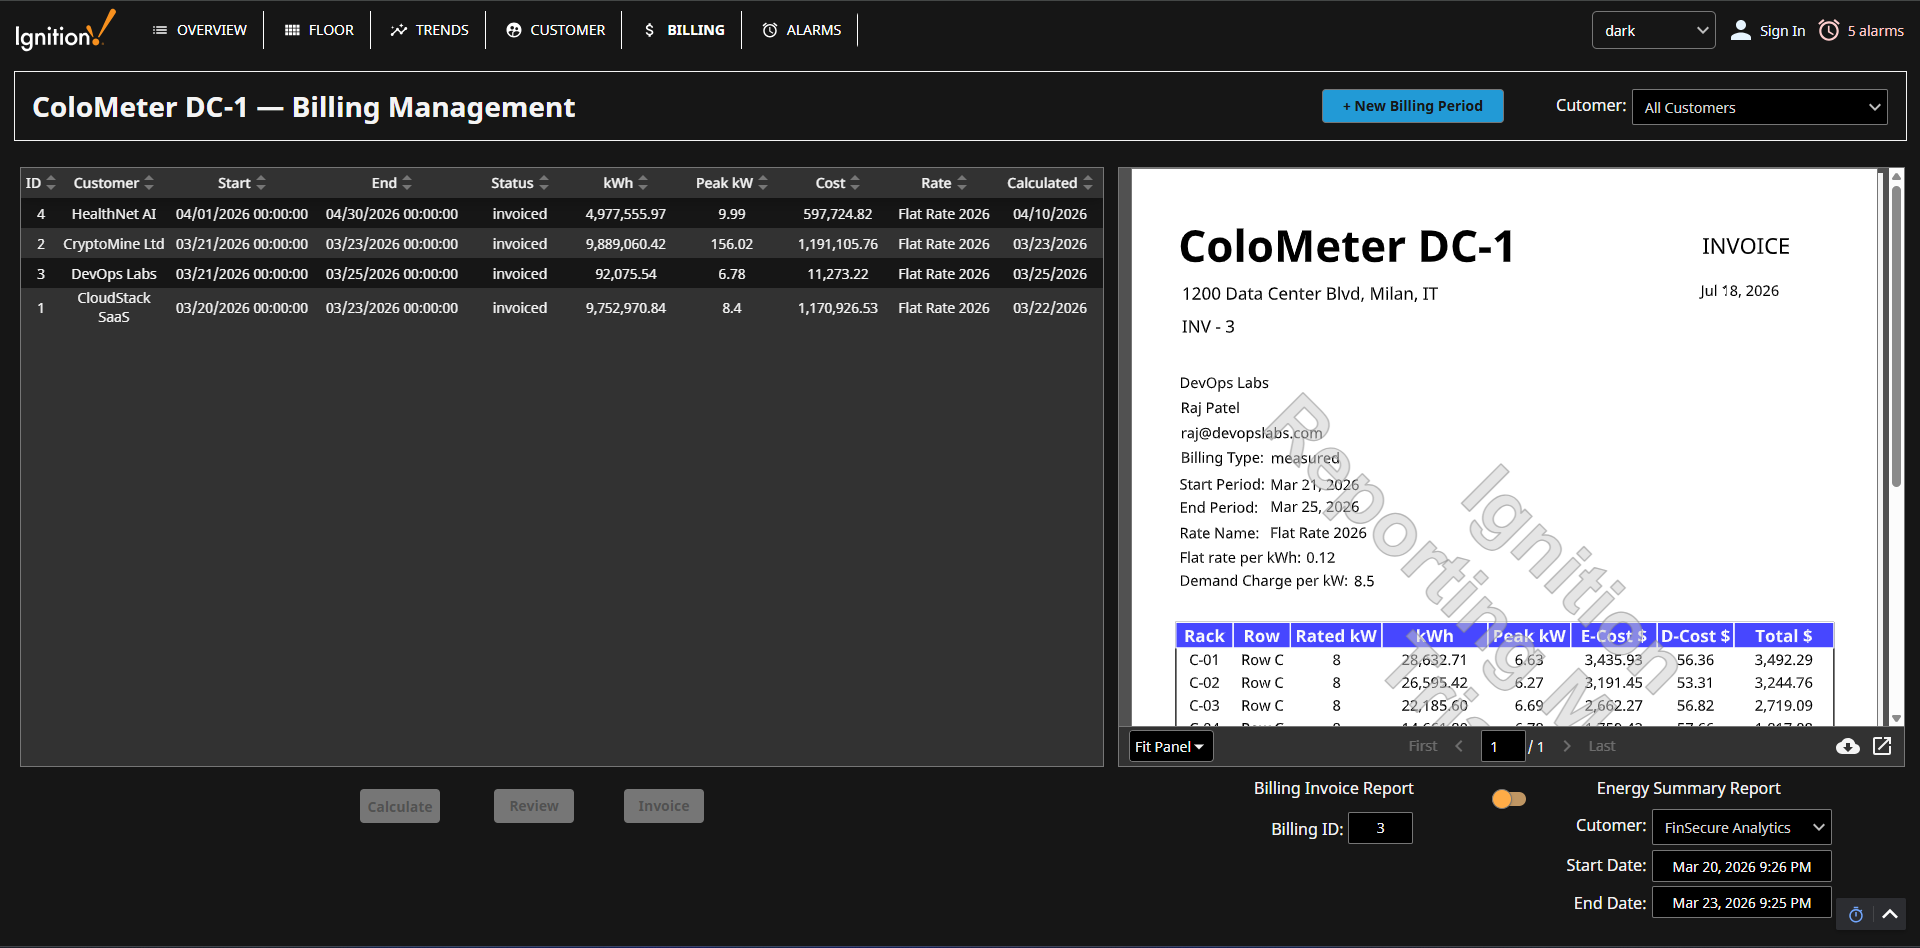
Ignition's reporting module generates PDF invoices. Admins create billing periods, pick flat or demand-based rates, and calculate costs in one click — with a review-and-finalize step.
See the whole floor at a glance
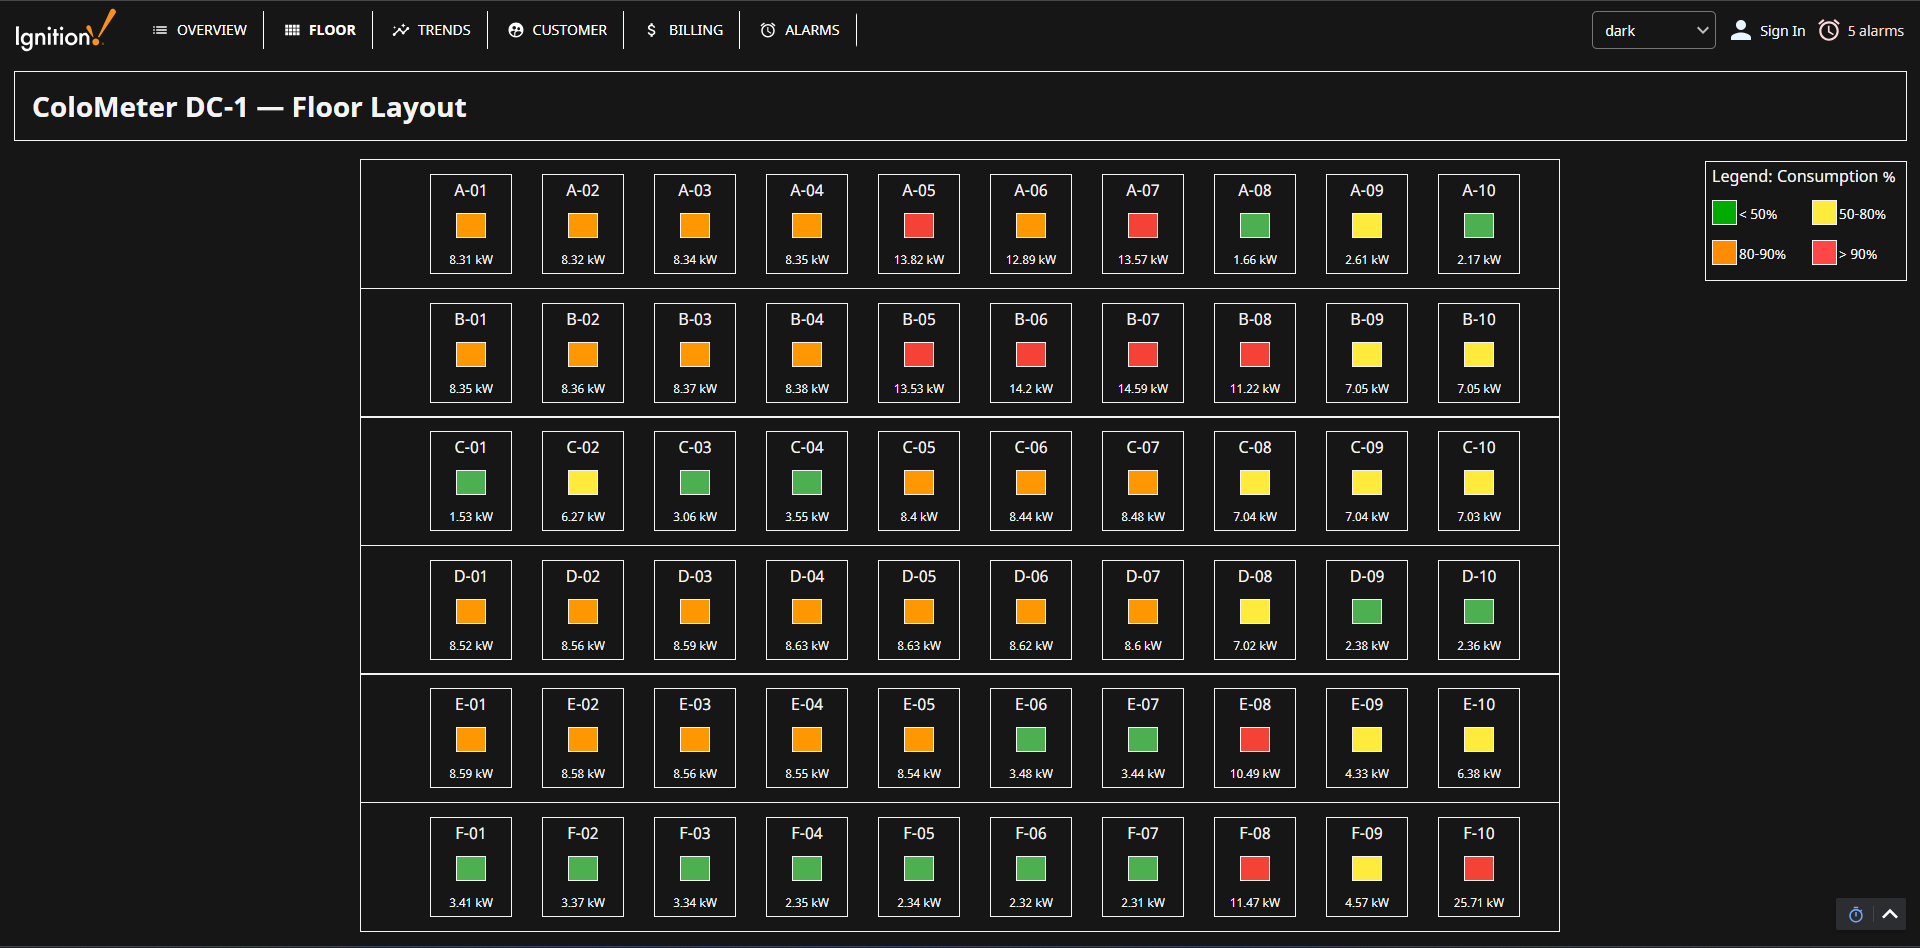
The interactive floor plan lays out all 60 PDUs as a color-coded grid — green under 50%, yellow 50–80%, orange 80–90%, red over 90%. An operator spots a hot rack in a second, without reading a single number, then clicks in for the detail.
The floor layout: 60 PDUs color-coded by consumption, with an at-a-glance capacity legend
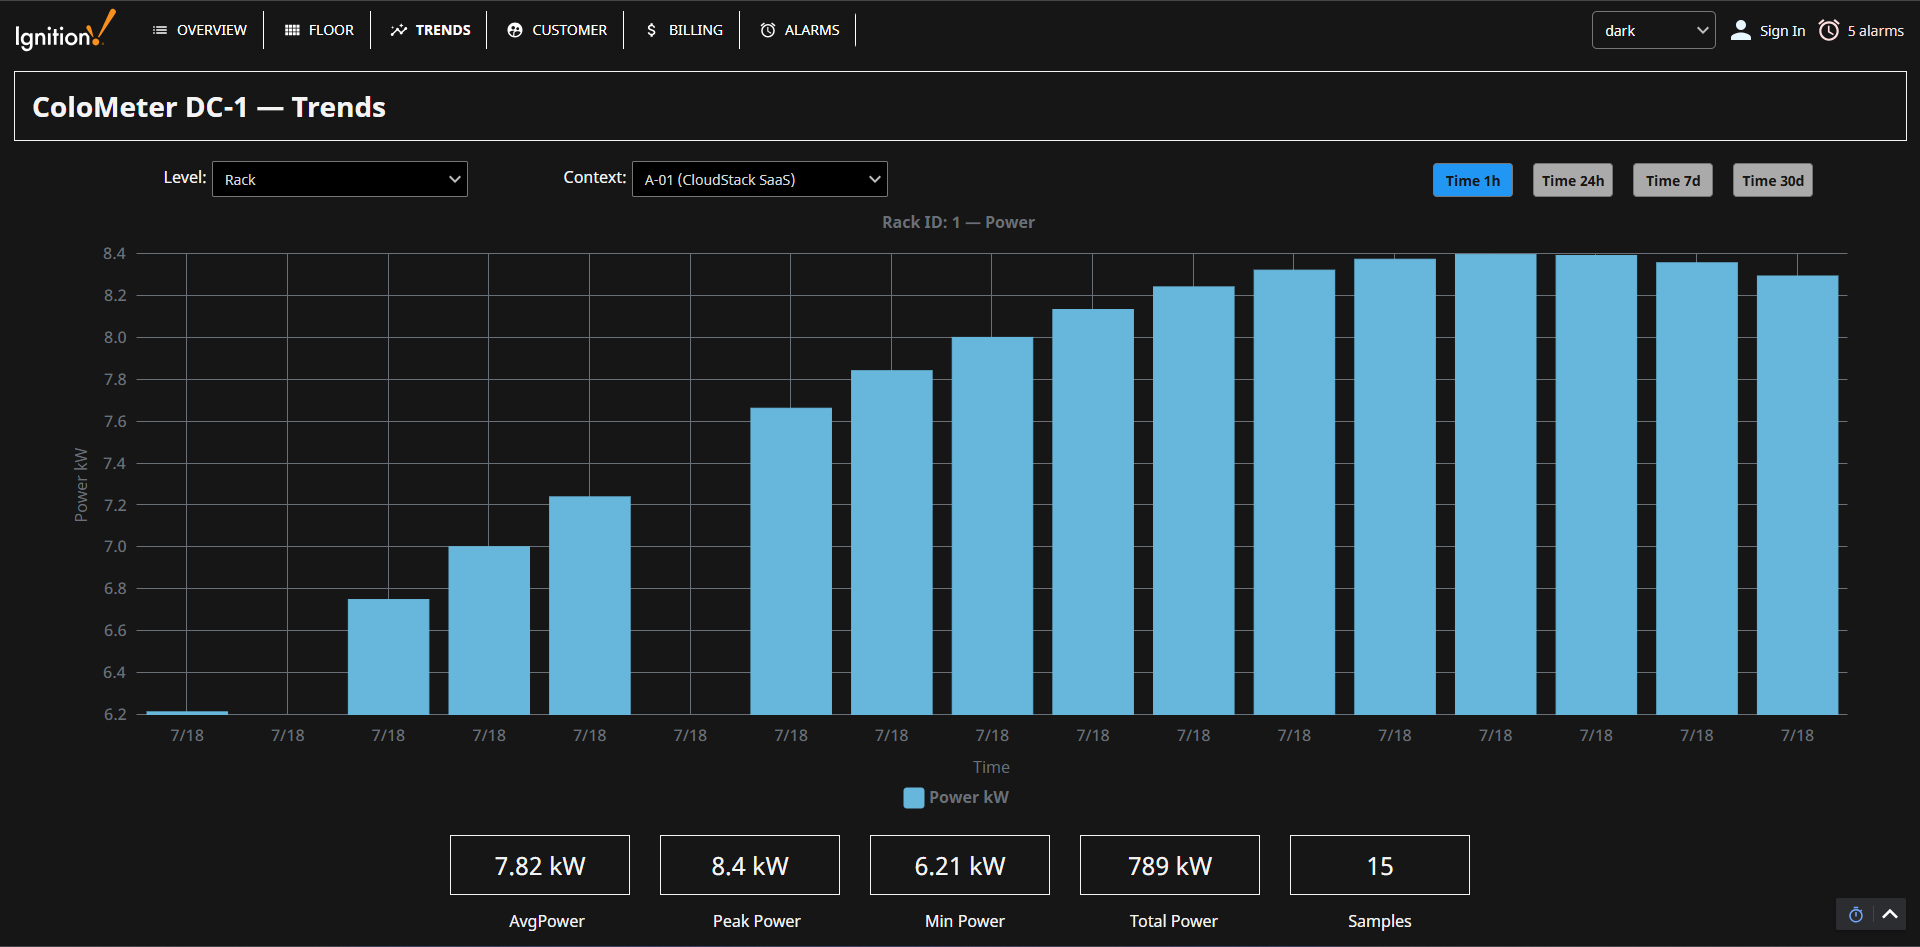
Drill into any rack: power trends over 1h / 24h / 7d / 30d with avg, peak, min and total
Trends that turn data into decisions
Selecting a rack opens XY trend charts backed by the SQL historian — average, peak, minimum and total power across selectable time windows. This is what makes PUE actionable: operators see the effect of an infrastructure change immediately, and keep the facility inside the efficient band.
A live portal for every customer
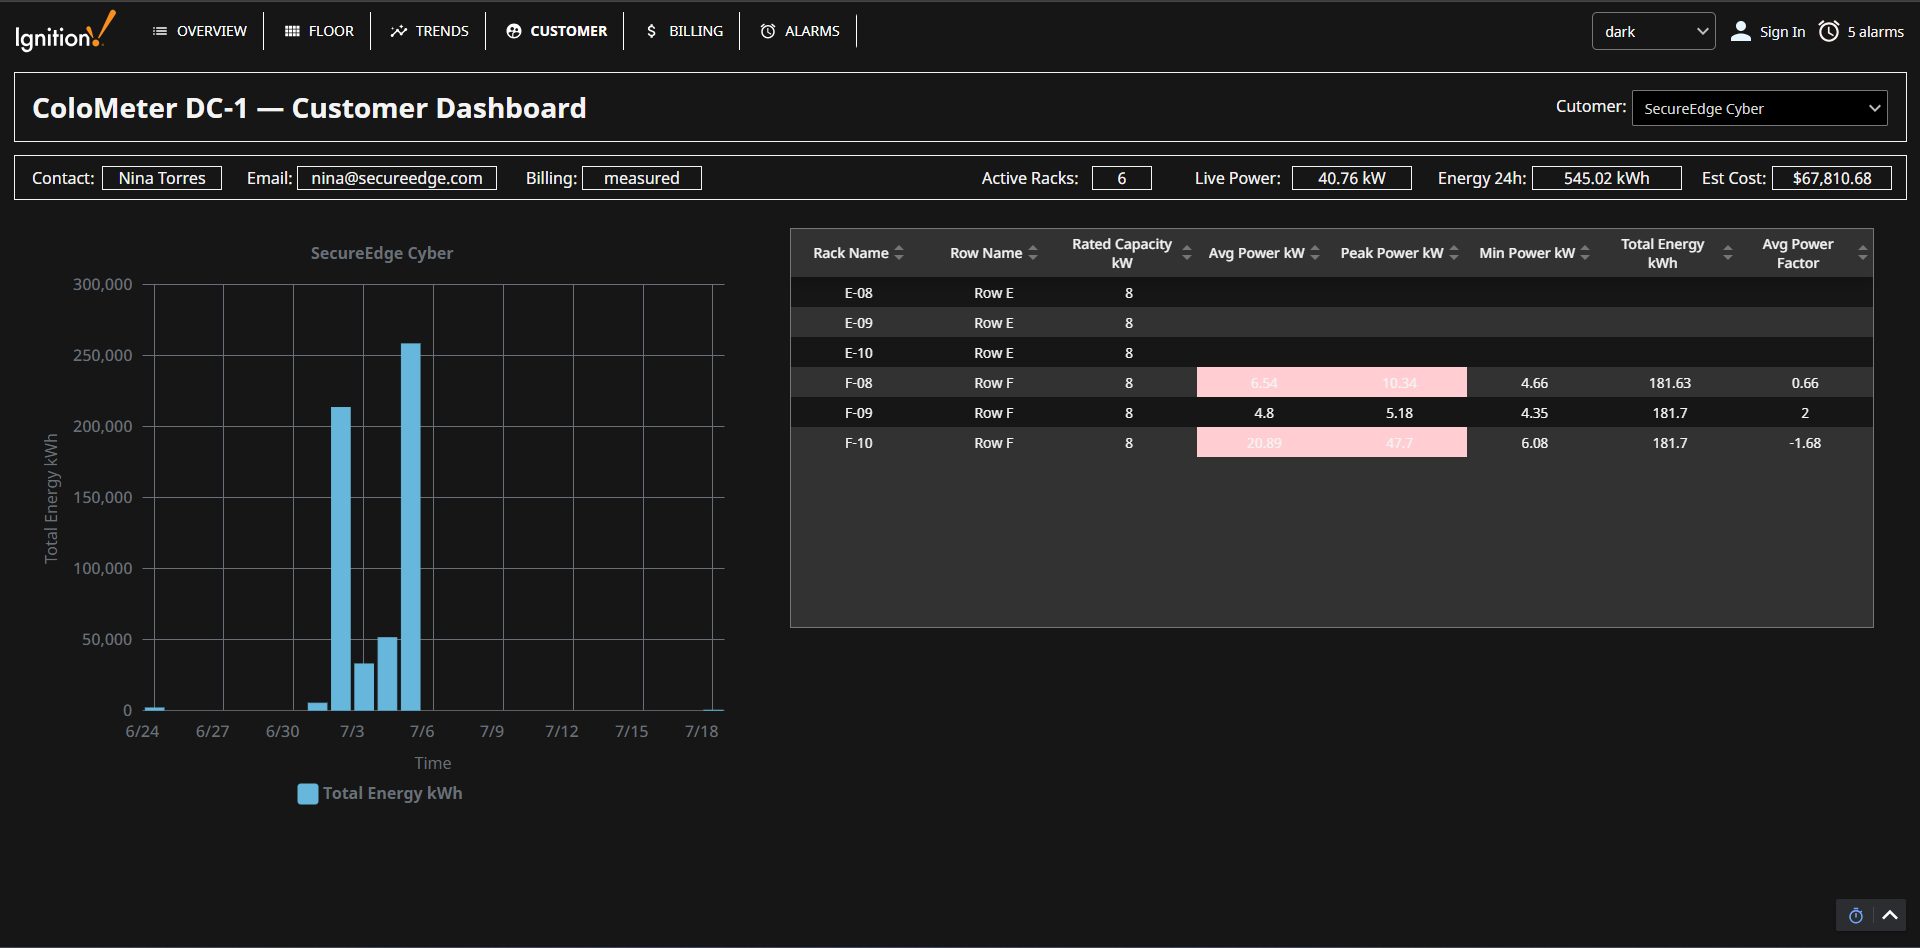
Each colocation customer gets a filtered view of only their racks — contact details, active racks, live power, 24-hour energy and estimated cost, plus a per-rack breakdown. High-consumption cells turn red, nudging customers toward better energy habits and heading off billing disputes before they start.
A customer dashboard: live power, estimated cost and a per-rack breakdown, filtered to one customer
Billing management: create a period, Calculate → Review → Invoice, and generate a branded PDF
Select, calculate, generate
What used to be manual spreadsheet work is now a three-step workflow. Administrators create a billing period, choose a flat or demand-based rate, and the engine calculates each rack’s energy and demand cost against the SQL history — then generates a finalized PDF invoice. Peak-demand charges are captured accurately, protecting the data center’s margins.
A safety net that never blinks
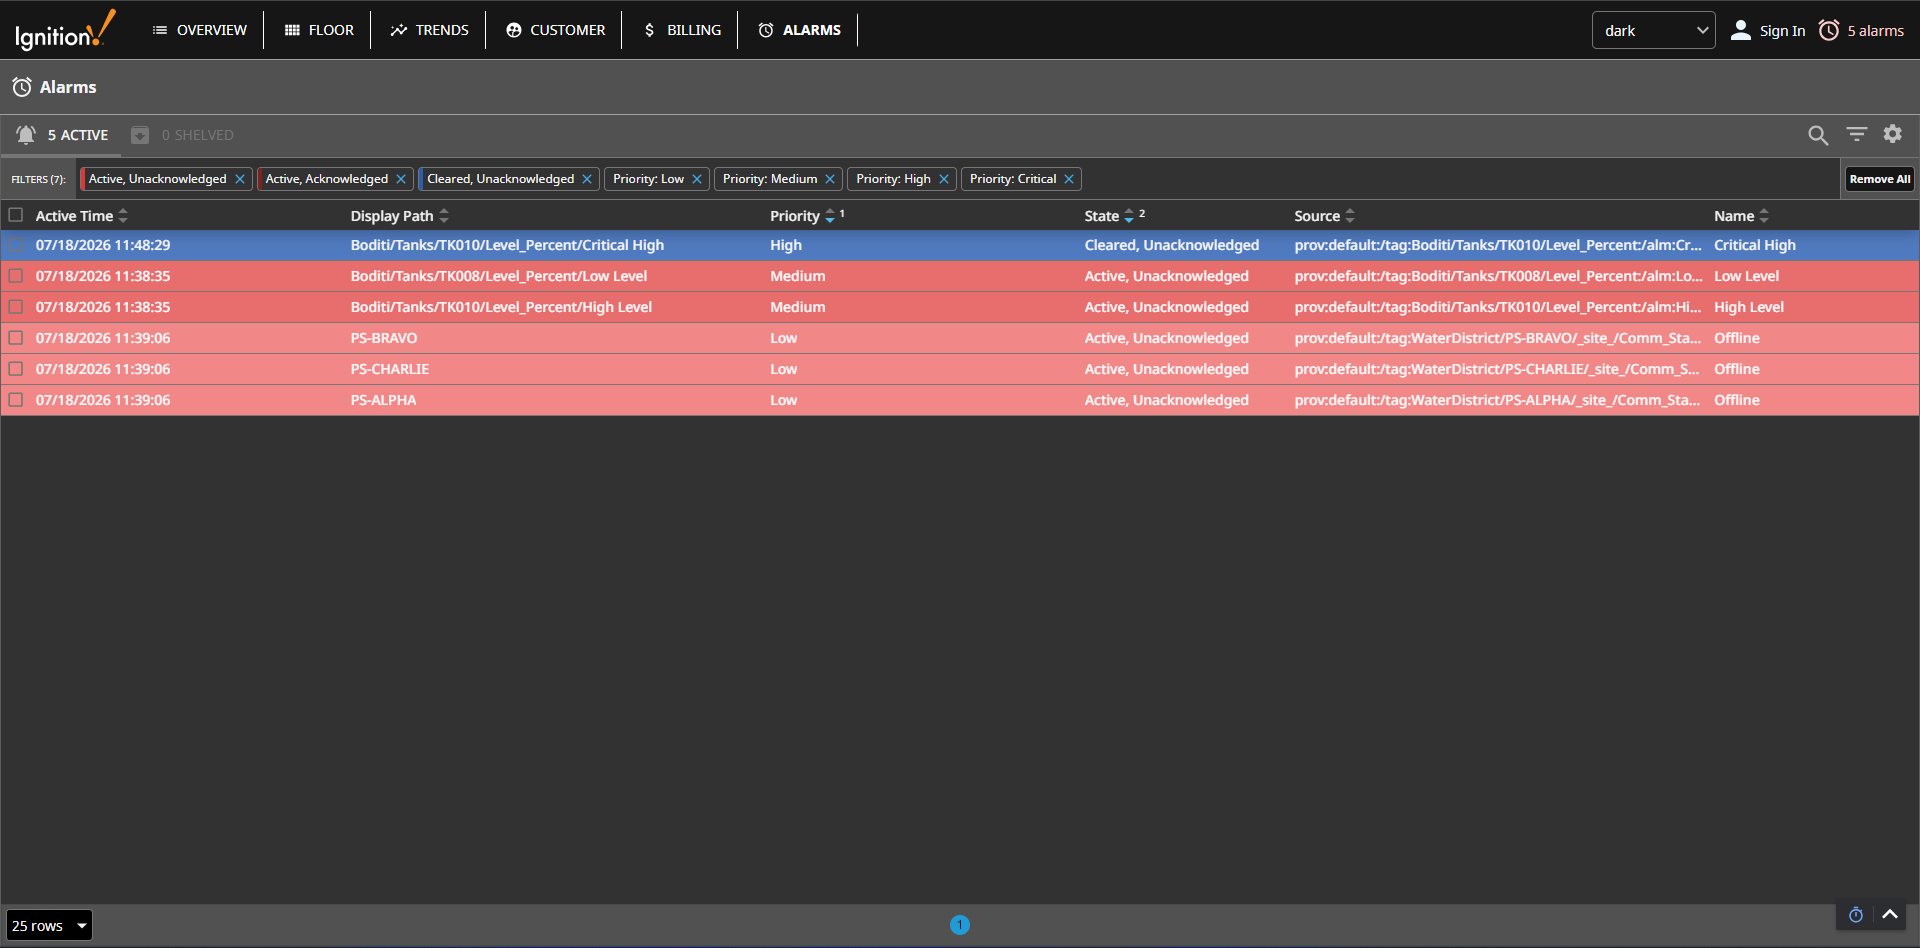
The alarming section instantly notifies technicians through the Ignition platform the moment any rack enters a “red” status — a critical early warning that can prevent equipment failure from overheating. Alarms are filterable by state and priority, so the most urgent events surface first.
Real-time alarming filtered by state and priority — the early warning for a rack going critical
● RESULTS & IMPACT
From reactive operations to proactive control.
Efficiency
Live PUE gives immediate feedback on infrastructure changes, keeping the facility in the good 1.1–1.4 range.
Transparency
Customers view their own usage in a dedicated portal — fewer billing disputes and better energy habits.
Automation
A manual calculation process became a streamlined Select → Calculate → Generate workflow that captures peak-demand costs accurately.
Built to scale
The platform was architected around User-Defined Types (UDTs) for the PDUs, so adding another 60 units or 10 racks takes a fraction of the original development time. It was delivered end-to-end — Ignition architecture, SQL schemas for historical logging, the multi-tier billing logic, and the Perspective/Vision UI including the interactive floor plan, trend charts and automated customer reports — as a single cohesive vision grounded in user-centric engineering.
Turning power data into accurate revenue?
From PDU monitoring and PUE to automated colocation billing, we build Ignition platforms that pay for themselves in efficiency and captured revenue. Book a free consultation and we’ll scope it with you.